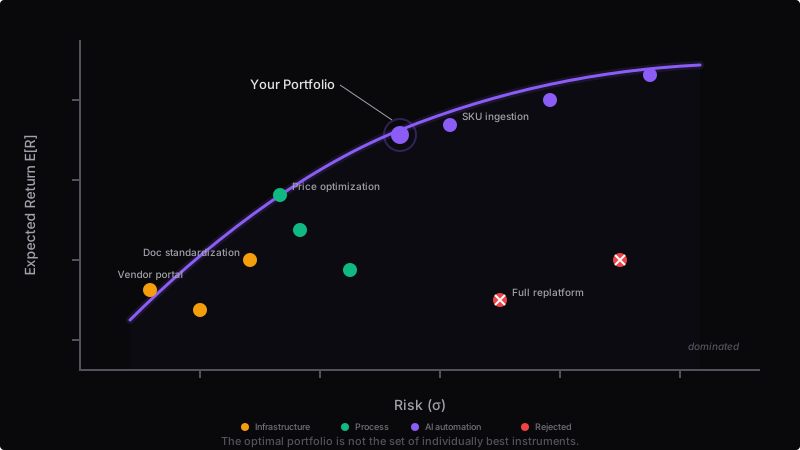
Stop ranking projects one at a time. Construct a portfolio.
Every operating decision - automation, build, hire, process change - is an instrument with a return distribution; rank by Sharpe, map tolerances, handle correlations, find the frontier.
Squares are individual interventions. The line is the best achievable mix at each return; faint dots are other feasible mixes. Click the line or move the slider to see the allocation.
Max-Sharpe portfolio
- Annual return
- 33.6%
- Annual risk σ
- 16.9%
- Sharpe
- 1.75
| Intervention | Return | Risk σ | Weight |
|---|---|---|---|
| 18.0% | 14.0% | 32.1% | |
| 28.0% | 20.0% | 36.5% | |
| 45.0% | 32.0% | 14.0% | |
| 65.0% | 46.0% | 17.4% |
Bullish scenario assumptions
Illustrative annual net returns on allocated capital, not measured forecasts. Risk is the annual standard deviation of those returns. Allocations sum to 100%, with no shorting or leverage; interventions are assumed divisible. Sharpe uses a 4.0% annual risk-free benchmark. Cash is not an investable asset in this frontier.
| Intervention | Vendor | Docs | Pricing | SKU |
|---|---|---|---|---|
| Vendor | 1.00 | 0.25 | 0.30 | 0.25 |
| Docs | 0.25 | 1.00 | 0.35 | 0.20 |
| Pricing | 0.30 | 0.35 | 1.00 | 0.50 |
| SKU | 0.25 | 0.20 | 0.50 | 1.00 |
The Problem
Standard corporate capital budgeting evaluates projects one at a time. Calculate NPV. Check the IRR against a hurdle rate. Accept or reject. Next project. This is how most technology organizations run their roadmaps.
That's not portfolio construction. It ignores correlations between projects, doesn't account for risk tolerance curves, and treats every investment as independent. Two projects with the same expected return but different variance get treated as equivalent. They aren't.
The Four Steps
1. Rank by Sharpe, Not NPV
E[R] / sigma(R). Two automations with equal NPV but different execution risk are not equivalent. Prefer the higher Sharpe when risk tolerance is moderate.
NPV tells you the expected return. Sharpe tells you the risk-adjusted return. The second is what you actually want to maximize.
2. Map Risk Tolerances
Low tolerance for market share loss in a given year? That is a left-tail constraint. Price it. Cash flow needs in Q3? That is a timing constraint. Capacity for only N simultaneous builds? That is a resource constraint.
Risk tolerances aren't preferences. They're constraints on which portfolios are feasible.
3. Handle Correlations
Two builds sharing the same team have correlated execution risk. If one slips, both slip. You can't sum their individual Sharpe ratios and call it a portfolio.
Technology dependencies, shared personnel, seasonal demand patterns - correlations hide in the operating context. Name them or they will surprise you.
4. Find the Efficient Frontier
The set of portfolios that maximize expected return for a given level of risk. Pick the point on the frontier that matches your risk tolerance curve. Deploy capital top-down.
This is Markowitz (1952) applied to operating investments. The math is the same. The inputs are different. Instead of stock returns, you have operating outcomes.
The Builder Advantage
Portfolio construction is only as good as your instrument models. If the return distributions are wrong, the frontier is wrong. And the single largest source of estimation error in operating investments is the cost side - how hard it is to build the thing.
A CTO who doesn't build has to rely on estimates from the team. Those estimates have high variance - optimistic when the team is excited, pessimistic when they are fatigued, systematically biased by anchoring to the last project. The cost side of the return distribution is wide.
A CTO who builds has a direct informational advantage. They know what a three-week project feels like because they have shipped three-week projects. The cost estimate has lower sigma. Lower sigma on cost means a tighter return distribution. Tighter distributions mean better portfolio construction.
Each circle contributes a necessary input to the allocation function. Remove any one and the portfolio construction degrades.
Where AI Fits
AI isn't the thesis. AI is a parameter shift in the instrument characterization step.
What AI did: shifted a large class of operating instruments from “not worth building” to “high Sharpe.” Tasks that had T ~ 1 (no leverage) suddenly have T >> 1 (massive leverage). The menu of viable investments expanded.
When the set of investable opportunities is small, allocation is easy - fund each viable candidate. When the set expands, allocation becomes the bottleneck. You need to select from a much larger menu. This is why the allocation discipline becomes more important in an AI-enabled operating environment, not less.
The Five-Stage Allocation Cycle
This framework sits at Stage 3 of a five-stage cycle. The other frameworks and tools on this site cover the remaining stages.
Connection to Other Frameworks
Directed Graph - finds the mispriced edges. Capital Allocation ranks them and constructs the portfolio.
Knowledge Capital - determines which instruments are compounders vs wasting assets. The dual curve feeds the return distribution.
Construction Spread - the point estimate (risk-adjusted yield) of a single instrument. Capital Allocation extends this to full distributions and portfolio-level optimization.
Automation NPV - models the economics of an individual instrument. Capital Allocation uses these as inputs to portfolio construction.
When this framework fails
Portfolio construction is falsifiable - here are the conditions under which the thesis breaks:
- -Single-decision environments. If there is no portfolio (one instrument, no alternatives, no correlations), use NPV or IRR. Portfolio theory adds overhead without adding signal.
- -Unmeasurable expected return. The frontier requires numbers. If returns are pure optionality (unquantifiable upside, unknown-unknown risk), Sharpe ranking is worse than just taking the bet. Use real-options valuation instead.
- -Infinite capital. If risk budget and execution capacity are truly unbounded, frontier logic collapses: just take every positive-NPV bet. The frontier matters only under binding constraints.
- -Strategic or regulatory slots. An instrument may be worth holding below its Sharpe score for optionality, relationship, or compliance reasons. Mark those as carried positions and allocate the rest - do not pretend the portfolio math alone justifies them.
A falsifiable prediction from this framework: two teams with the same instrument menu but different portfolio discipline will diverge in realized Sharpe over a 4-to-8-quarter window. If they do not, the framework is wrong for that environment.
Rosetta Stone
Four circles, four readings of the same object. Each role reads the artifact through its own lens.
The native domain. Rank by Sharpe, map the correlation matrix, set risk tolerance, construct the efficient frontier, deploy top-down. This is what allocation is, applied to operating instruments instead of securities.
The seat where you stop running individual projects and start running a portfolio. "How is Q3 doing?" becomes a question about the portfolio, not the five biggest initiatives. The cadence of the operating review changes when you manage correlation.
A bill of materials for the year. Given capacity, skills, and dependencies, which combination of builds ships the most value? The plan is a portfolio; every staffing decision is an allocation.
Mean-variance optimization over operating instruments with a non-Gaussian return distribution. Correlation matters more than in public equities because execution dependencies are shared. The real optimization minimizes tail risk subject to an expected-return floor.