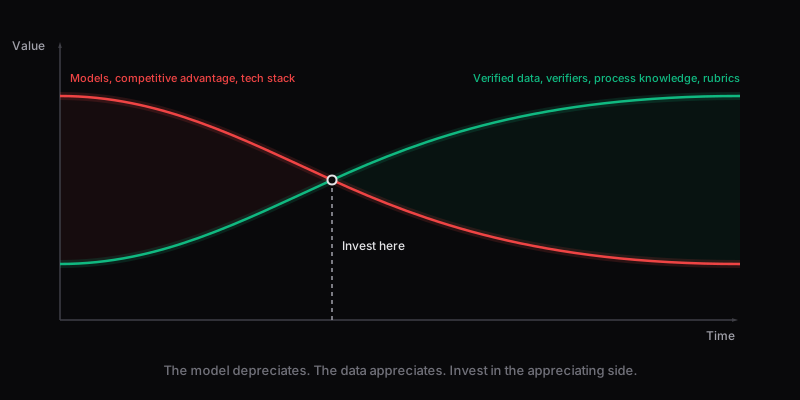
Models are the truck. Verifiers and data are the land.
Spend on the side that compounds with use; the dual curve says which dollar of operating spend is the dominant bet.
Drag along the chart to scrub time. Model value 46, data value 20.
The Dual Curve
Physical assets depreciate. A truck loses value from day one. A warehouse degrades. A machine wears out. The NPV calculation bakes in declining value.
Knowledge assets have a dual curve. Some components depreciate while others appreciate, and the net rate determines whether you are building a wasting asset or a compounding one.
Depreciates
- ↓Models - distribution shift degrades performance over time
- ↓Competitive advantage - others build the same capability
- ↓Technology stack - obsolescence, version churn, API changes
- ↓Individual knowledge - walks out the door when the person leaves
Appreciates through operating use
- ↑Verified data - each run generates labeled examples; the corpus grows with volume
- ↑Verifiers - each failure caught is encoded; the floor ratchets up with every run
- ↑Process knowledge - understanding where failures cluster is cumulative
- ↑Institutional rubrics - codified judgment that survives personnel changes
The Investment Implication
The optimal strategy follows from the dual curve: invest in the appreciating side.
Use commodity models - they are the truck. Replaceable, depreciating. Do not build custom models unless the data moat justifies it.
Build proprietary verifiers and data pipelines - they are the land under the depot. Distinctive, compounding, increasingly expensive for a competitor to replicate.
The Automation NPV calculator models both curves. When appreciation exceeds depreciation, the knowledge asset is a compounder. When it does not, it is a wasting asset - and you should stop investing.
Compile Time vs. Runtime
This framework changes how leaders should spend their time.
Compile Time
Building systems, frameworks, rubrics, processes. Creating assets that produce returns over many future periods.
Writing the verifier, designing the rubric, building the graph, defining the cost function, creating the case form.
Runtime
Executing tasks, fighting fires, reviewing outputs. Consuming assets that produce returns in a single period.
Running the report, reviewing the output, approving the request, attending the meeting, answering the email.
Every hour of compile time produces returns across all future periods. Every hour of runtime produces returns in exactly one period. The ROI of compile time is multiplicative. The ROI of runtime is additive. Leaders who spend most of their time in runtime are choosing the additive path.
Proof of Trust Is the New Scarcity
When knowledge generation is cheap - when any LLM can produce analysis, hypotheses, content, decisions - the scarce resource is proof that you can trust the output.
This is why the Proof Layer is built before the capability. Every knowledge asset needs:
Worked example: evaluation corpora at a retail holding company
In practice: an AI pipeline for product catalog quality produces scored decisions as a side effect. The model depreciates - each new model generation rots the specific prompts, few-shot examples, and scaffolding that wrap it. The evaluation corpus appreciates - every labeled outcome becomes training data or a test case, and its value only grows as the corpus gets wider.
Specifically, on a real deployment the ratio of labeling effort (one-time spend) to future evaluation runs that use those labels (indefinite use) produced a dual curve where the model spend rolled over within months and the corpus spend kept compounding. That was the trigger to invest in labeling infrastructure rather than prompt sophistication. The framework told the team where to put the next dollar.
When the dual-curve model fails
The framework makes a falsifiable prediction: dollars spent on appreciating assets (data, verifiers) will outperform dollars spent on depreciating assets (prompts, scaffolds) over a 2-to-8-quarter horizon. If measured ROI does not diverge along that axis, the classification is wrong for that system.
- -Rapidly shifting task definition. If the thing you are evaluating changes faster than the corpus accumulates, old labels go stale. Data becomes a depreciating asset in that environment.
- -Context-window-only usage. If the prompt is the product (no external eval harness, no retention of labeled outcomes), model improvements move directly to value. The appreciation-curve investment has no hook to land on.
- -Verifier cost equals or exceeds generator cost. The framework assumes verifiers can be cheaper than the generators they grade. When that fails, the verifier stops being a capital asset.
- -No mechanism to use accumulated data. If your data pipeline cannot reliably feed downstream training or evaluation, you have warehousing, not capital. The appreciation is only theoretical.
Rosetta Stone
Four circles, four readings of the same object. Each role reads the artifact through its own lens.
The asset category. Knowledge work is a capital asset with a dual curve: the model side depreciates (distribution shift, competitive erosion), the verifier and data side appreciates through operating use. The portfolio tilt should favor the appreciating side.
The distinction between work that produces once (a run) and work that produces forever (a rubric, a playbook, a verifier). Shifting the team's time toward the latter is the highest-leverage management move.
The architectural choice between coding the answer and coding the test. The test is the durable asset; the answer depreciates with the model version.
Two coupled processes: model decay (loss of i.i.d. assumption over time) and verifier learning (increasing ground-truth coverage, tighter posterior). Net compounding depends on the sign of their difference.